By Thomas F. Cooley and Peter Rupert
A kind of silly debate has broken out among economists over whether our recent downturn deserves the label “The Great Recession.” We’ll leave it to others to sort this out. But we would argue that the downturn in the housing sector is pretty “great”–far worse than in past recessions. Periodically in this column we have presented a visual assessment of where we stand in the current recession, with a focus on consumption, investment and employment. This week we look at housing.
There were suggestions in the media this week that there might be a turnaround in housing because there was a slight drop in delinquencies and total foreclosures–but you really have to be an unconstrained optimist to see the housing market as anything but dire.
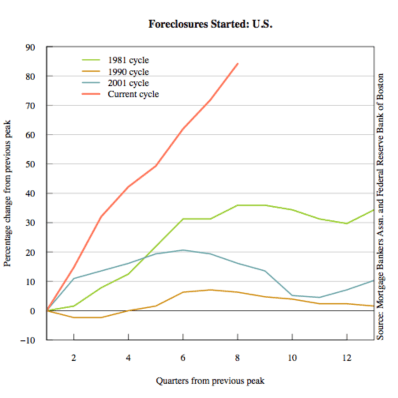
The behavior of the housing sector over this recession is unlike anything in recent history. This can easily be seen in the first figure below, which shows the percentage increase in foreclosures over the past several recessions. The housing meltdown started with a vengeance; in less than a year the percentage increase in foreclosures since the previous peak was already twice as high as during any other recession in recent history.
The current housing downturn has been particularly acute in several states–California, Nevada, Arizona and Florida–but it isn’t confined to them. Ohio, Michigan and many states that did not have huge housing price increases have also been hit hard. What is different about this cycle isn’t that housing prices declined. And it isn’t that foreclosures increased considerably. It is that while previous housing cycles were, more or less, regional phenomena, this one is far more universal.
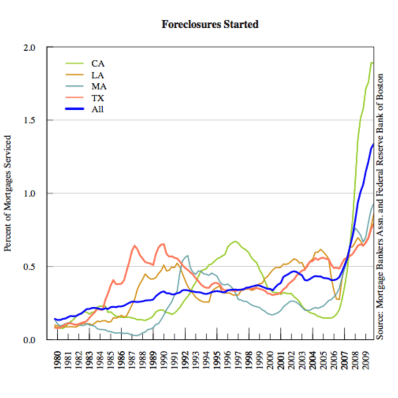
In the 1980s there was downturn in the housing market in Texas, associated with falling oil process and a sharp decline in the energy industry. In the late 1980s and early 1990s there was a sharp decline in housing in Massachusetts associated with a decline in much of the technology sector. In the early 1990s there was a sharp decline in the housing sector in California, associated with the recession but also compounded by the cutbacks in the aerospace industry. Those cycles were more localized and associated with specific shocks to specific regions.
These regional cycles show up in the second figure below that plots foreclosures started for several states as well as for the U.S. as a whole. What is striking is that these regional cycles do not show up very much in the aggregate data. But when we get to 2008 the story changes. This cycle shows up in all of these states and the national data.
The Perfect Foreclosure Storm
In the current recession several factors have aligned to drive the large and rapid increase in foreclosures, and it appears likely that foreclosure rates might stay high for some time. What leads to increasing foreclosure rates during some recessions and not others? In the perfect storm scenario what happens is that falling house prices (leading to a negative equity position in a house) combined with a job loss can lead to default and a foreclosure. So here it is because of both negative equity and unemployment that foreclosures rise.
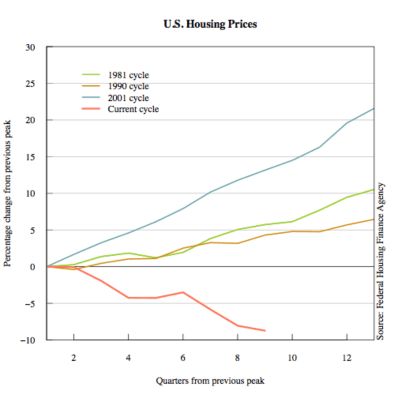
The third figure, below, shows the dramatic fall in housing prices associated with this business cycle. In previous business cycles the downturn in prices was barely noticeable or non-existent. The decline in the employment population ratio in this recession has been equally dramatic.
Some observers have pointed to the fact that foreclosures began to increase in mid-2006 while unemployment rates were still falling (these did not start to rise until mid-2007), and conclude that unemployment could not be a cause of the rise in foreclosures. What is often overlooked, though, is that there are large flows into unemployment each week. Indeed, in a typical week roughly 350,000 individuals file initial claims for unemployment. During the depth of this recession, about 600,000 per week were entering the unemployment rolls. It is important to realize that total employment can stay constant even with 350,000 people per week entering unemployment.
What is more likely to cause the delinquency in house payments and foreclosure is the loss of jobs, not the number of people without jobs–an important distinction. In addition, the length of unemployment spells (the duration of unemployment) is also an issue. Unemployment duration always rises in recessions. Job-losers flood the unemployment pool at the same time that employers demand for labor falls. The increase in the number of job-seekers relative to vacancies means the job-losers will spend a longer time unemployed.
But the increase in the duration of unemployment in this recession is dramatic–unprecedented in any postwar business cycle. The percentage of the labor force unemployed for at least six months increased to 4.3% of the labor force. The previous high, reached in 1983, was 2.6% of the labor force.
On the other side of this story is the fact that if housing prices are rising during a recession then foreclosures may not increase, even with increases in unemployment rates. For example, during the 2001 recession unemployment in California increased from about 4.7% in January 2001 to about 6.5% one year later. Housing prices were rising during this time period in California and foreclosures were actually declining.
Where are we now?
In early 2009 the Obama administration introduced a $75 billion homeowner assistance program that was to help those homeowners with underwater mortgages and at risk of default and foreclosure. Some $50 billion of this was allocated from the TARP bailout funds. It had very little noticeable impact in part because it was poorly designed. Nearly 2.8 million foreclosures were initiated in 2009. So far in 2010 there have been more than 932,000 foreclosure filings in the first quarter, on pace to exceed 3.7 million foreclosures for the year.
The rate of secondary default–default by those who had their mortgages modified–has been extremely high. And all this because the unemployment problem remains. The policies are obviously not having the desired impact, and only a fraction of the money has been used. The administration announced in March a revision of the program that includes further incentives to write down the principal amount of the loans and subsidizes lenders who offer forbearance for up to six months for unemployed borrowers.
We are not near the end of this housing cycle, and there is more pain yet to be borne. There is evidence that official listing data understate the inventory of unsold housing, and this will continue to put downward pressure on housing prices. When we compare this housing cycle to other housing cycles (as opposed to business cycles), like those in Massachusetts, Texas and California, we still have a lot of adjustment to take place. Whether or not this economic downturn merits being called the Great Recession, it sure is a Great Housing Bust.
Thomas F. Cooley, the Paganelli-Bull professor of economics and former dean of the NYU Stern School of Business, writes a weekly column for Forbes. He is a co-editor of the forthcoming book Regulating Wall Street: The New Architecture of Global Finance.
Peter Rupert is a professor of economics and associate director of the Laboratory for Aggregate Economics and Finance at the University of California, Santa Barbara.


